The Open Apiary
Project
Saving Bees Through Data

The Open Apiary Project deploys free ApisNode beehive monitors to beekeepers worldwide — putting real, continuous data behind every keeper's decisions while building the world's most comprehensive apiary health database to combat Colony Collapse Disorder.
Colony Collapse Disorder is Accelerating

Beekeepers in the United States lose an average of 40–50% of their managed colonies every year. Without intervention, the pollinators responsible for one-third of our food supply face an existential threat.

48%Annual Colony Loss
$15BUS Crop Value at Risk
1/3Food Supply Depends on Bees
80%Losses Go Undetected

Precision Technology for Every Beekeeper

By deploying free ApisNode beehive monitors to regional beekeepers, we are building the world's most comprehensive, anonymized apiary health database — empowering researchers and the agricultural sector to forecast swarming, detect Varroa blooms, and track climate-driven stressors in real-time. And for the keeper, one principle holds throughout: we don't tell you how to keep bees — we give you real evidence from your own hives, so you can make better-informed decisions.

📡

Free Sensor Deployments

Advanced LoRa-enabled ApisNode sensor kits distributed to beekeepers at no cost. Each kit monitors temperature, humidity, barometric pressure, 10-band acoustics, 6-band vibration, a 10-band gas (VOC) fingerprint, and hive tilt — 30+ metrics per cycle.

🧠

AI-Powered Analysis

Daily AI health reports fuse sensor telemetry with peer-reviewed bee science research and voice-transcribed field inspections. Beekeepers get colony health scores, early issue detection, and the evidence behind every observation — data to inform the decisions only a beekeeper can make.

🌍

Anonymized Open Database

All data is anonymized before aggregation — GPS coarsened to USDA hardiness zones, user IDs hashed, timestamps smoothed. The resulting database enables regional disease outbreak detection, climate correlation studies, and network-wide pollination forecasting.

🎙️ As Heard on Beekeeping Today Podcast

From Spacecraft to Beehives — Episode 402

Founder Dan Seitz joins hosts Jeff Ott and Becky Masterman to discuss how thousands of instrumented colonies — and the Open Apiary Project's anonymized open database — could reveal patterns in honey bee behavior that individual inspections can't see. Listen to the episode →

From Hive to Insight

Our end-to-end system transforms raw environmental data into actionable intelligence — automatically, continuously, and non-invasively.

01 📦

Deploy

Battery-powered sensor nodes install inside hives in seconds. An always-on gateway bridges the apiary to the cloud. Zero configuration required — devices auto-pair via proximity.

02 📊

Sense

Every few minutes, each node captures temperature, humidity, pressure, acoustic spectra, vibration spectra, a 10-step gas heater-scan fingerprint, and orientation — transmitting encrypted data over sub-GHz LoRa radio.

03 🧠

Analyze

Cloud-based AI fuses 24-hour telemetry with bee science research and field inspection notes to produce daily health scores, issue detection, and recommended actions for each colony.

04 🌐

Aggregate

Anonymized data feeds regional and network-wide health indices — enabling early detection of disease outbreaks, climate impact tracking, and pollination capacity forecasting across hardiness zones.

What the Data Enables

The aggregated, anonymized database already supports researchers, regulators, and the agricultural sector: network statistics are published daily, and anonymized row-level telemetry bundles are available to named researchers under a Data Use Agreement.

  • Forecast swarming events days before they occur using acoustic spectral signatures
  • Detect Varroa mite blooms through vibration pattern anomalies and grooming behavior markers
  • Track climate-driven stressors in real-time across USDA Plant Hardiness Zones
  • Surface early warning signs of disease stress (AFB, Nosema) through correlated VOC and temperature anomalies
  • Estimate pollination capacity through aggregated waggle dance activity levels
  • Provide state apiary inspectors with data-driven colony loss tracking
  • Support USDA/EPA bee census and Colony Collapse Disorder research
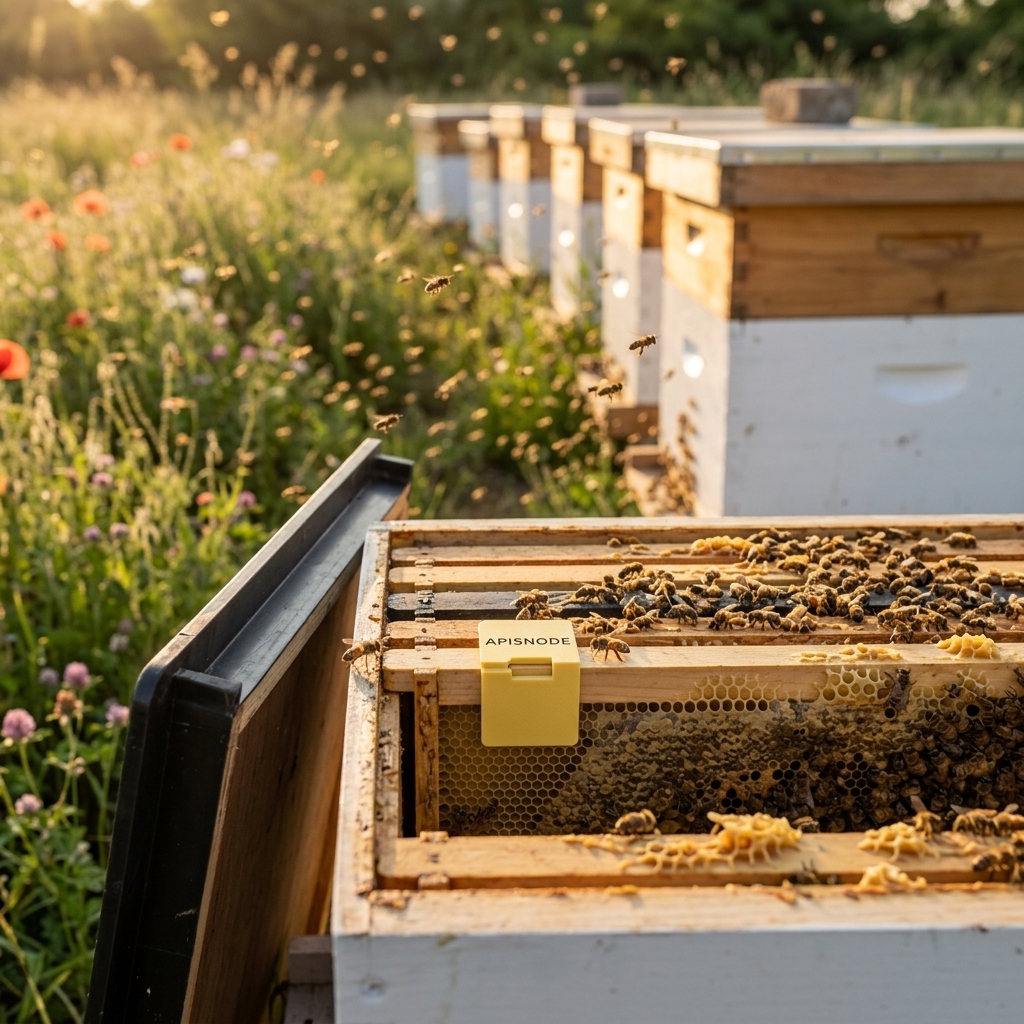
ApisNode sensor deployed inside a beehive

ApisNode sensor deployed between frames in a production New Mexico apiary

What The Colonies Are Telling Us

Every field-installed sensor in the network feeds these figures — pooled with no geography attached, recomputed and republished every morning at 07:00 UTC.

Loading the latest network figures…

Collection Sites, Region by Region

Every marker is a data collection region — shown by USDA hardiness zone, never by exact location. Explore the live network and read each region's daily analysis.

Open the interactive globe →

Every Hive, Analyzed Every Day

This isn't a someday database — it's already running. Every enrolled colony receives a daily AI health report that fuses 24 hours of sensor telemetry with peer-reviewed bee science. The openly-published reports below come from our founding demo apiary in Los Alamos, New Mexico — members' own reports stay private unless they choose to share them.

  • A plain-language health score and status for every colony
  • Diurnal cycle patterns — the daily rhythm of temperature, acoustics, and activity
  • Cross-sensor correlations grounded in named, peer-reviewed literature
  • Day-over-day continuity that surfaces trends before they become losses
Months

of daily reports — published openly and growing every single day, across every region in the network.

Browse the report archive →
💬 Ask the Reports Grounded in the Los Alamos demo apiary's daily analyses & peer-reviewed bee science — not raw sensor data
Ask me anything about what the daily colony-health analyses are showing — trends, what a signal means, how the science reads it.

From Prototype to Network Scale

We've successfully engineered a V1 prototype deployed across production apiaries. Now we're transitioning to a scalable, grant-funded international deployment.

Completed — V1 Prototype

Full-Stack System Engineering

Custom PCB design, embedded firmware, cloud infrastructure, AI analytics pipeline, mobile app, and web dashboards — all built and deployed in production apiaries with over-the-air updates.

Completed — Field Validation

Production Deployment & Iteration

Months of continuous field operation validating sensor accuracy, battery life, LoRa range, deep-sleep reliability, and AI analysis quality with real colonies across multiple seasons.

In Progress — 501(c)(3) Formation

Non-Profit Establishment

Filing for 501(c)(3) status to enable tax-deductible donations, grant eligibility, and institutional partnerships with universities and agricultural agencies.

Next — Grant Applications

Funding for Scale

Applying for USDA SBIR/STTR, NSF, EPA, and private foundation grants to fund manufacturing, distribution, and regional beekeeper onboarding across all 50 US states — while the trial program itself is open to beekeepers worldwide.

Future — V2 Hardware

Scalable Manufacturing

Design for Manufacturing (DFM) optimization, injection-molded enclosures, pick-and-place PCB assembly, and streamlined provisioning for thousand-unit production runs.

Help Us Save the Bees

Whether you're a beekeeper, researcher, engineer, or conservationist — there's a role for you in the Open Apiary Project.

🐝

Beekeepers

Receive free sensor kits, contribute anonymized data to the open network database — and download your own hives' full history as CSV any time. Apply for a free kit →

🔬

Researchers

Anonymized, row-level telemetry bundles are available under a Data Use Agreement. Email hive_master@apisnode.com with your affiliation, research question, time window, and variables needed.

💰

Donors & Grants

Fund the manufacturing and deployment of sensor networks across the growing network

🤝

Partners

Agricultural agencies, universities, and conservation organizations